Federal complaint record · NHTSA ODI snapshot 2026-07-19
Know what owners report before you buy
MotorCensus grouped 2,155,302 ODI vehicle component rows into 398,146 deduplicated matched complaint incidents. Published model-year records include cohort-relative signal indexes, intervals, reported mileage, and sample sizes. Complaint reports are not mechanical failure rates.
Ranked by complaint-signal index within same-segment, same-era cohorts
The signal board
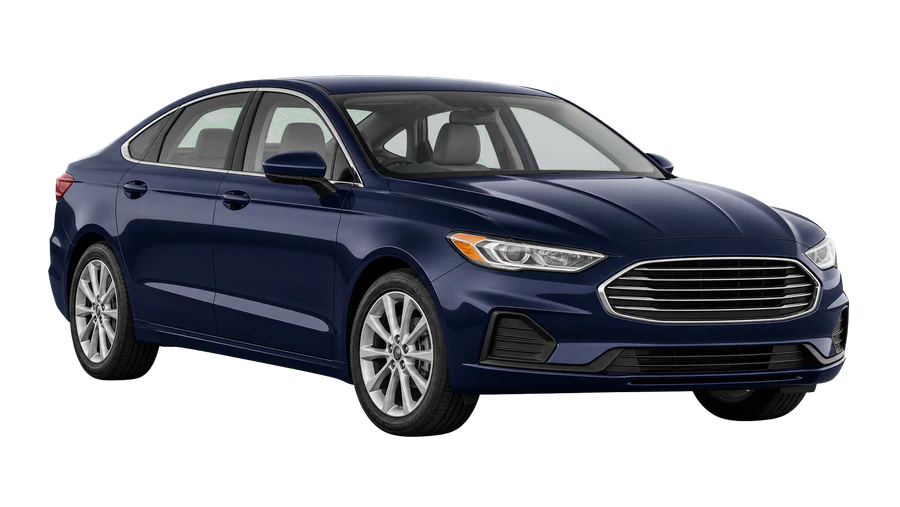
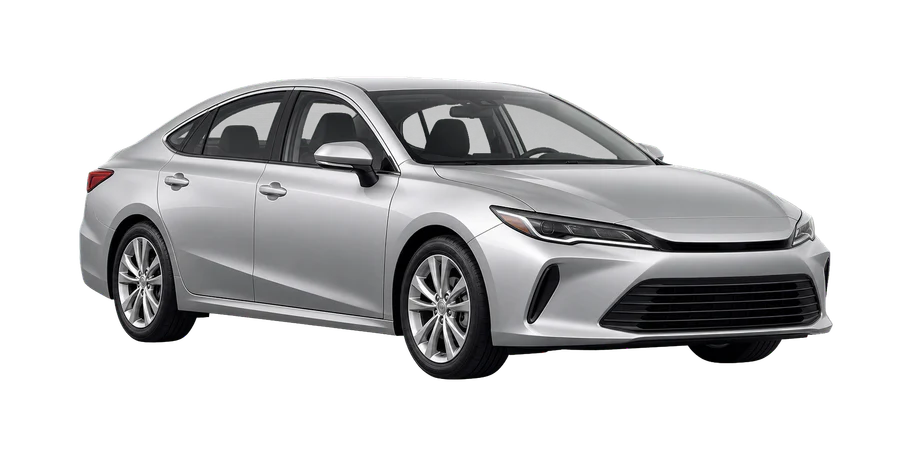
Original aggregate analysis over published records
Complaint pattern reports
Transmission complaint signals
2014 Ford Focus · 2002 Ford Explorer · 2012 Ford Focus
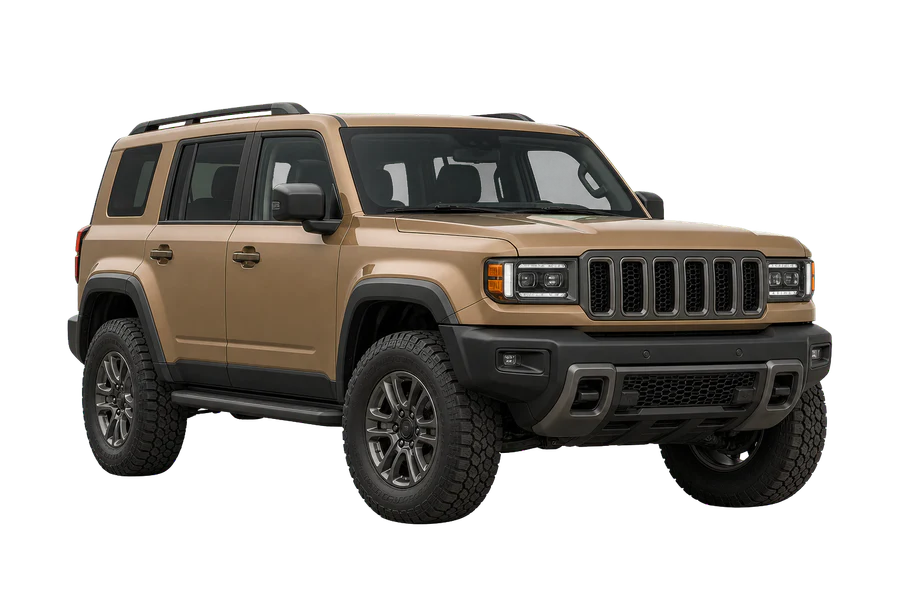
Electrical complaint signals
2005 Jeep Grand Cherokee · 2012 Jeep Grand Cherokee · 2006 Jeep Grand Cherokee
Brake complaint signals
2010 Ford Fusion · 2008 Honda Accord · 2008 Ford Fusion
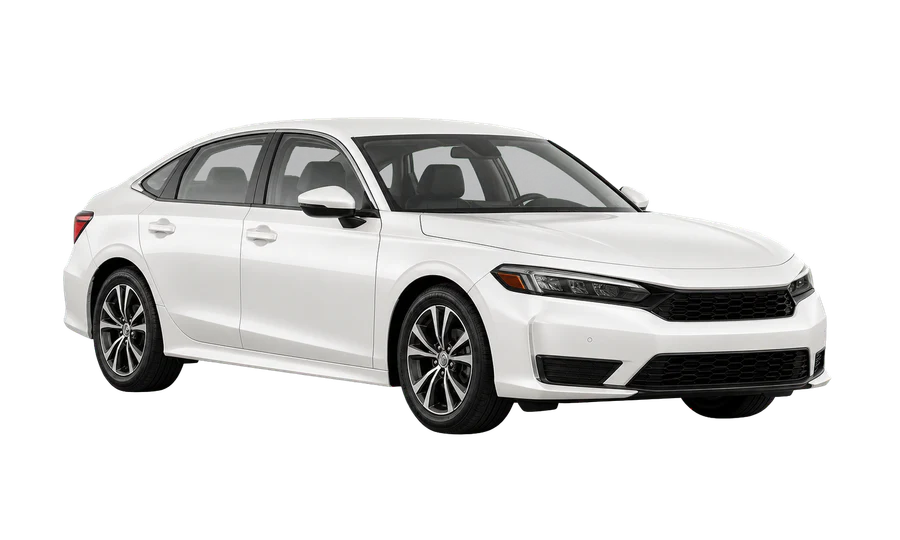
Curated pair with enough shared evidence for a call
Same question, measured records
The evidence rule favors the 2004 Jeep Grand Cherokee in this curated pair. Complaint signals describe submitted NHTSA reports, not mechanical failure rates.
Read the full comparisonThe record, mapped to the machine
Every complaint lives somewhere on the car
MotorCensus groups deduplicated complaint incidents by the component labels in the ODI source files, so you can see which systems owners mention before you stand in front of a car.
How the numbers are made
Statistics, not vibes
“If the data can’t support a claim, we don’t make it.”
Evidence counts on every record
Every complaint-signal index is shown with its complaint-report count and bootstrapped 95% interval. Mileage and component summaries show their supporting sample counts when publishable, and are suppressed when the evidence rule is not met.
Cohorts, not leaderboards
A 2013 midsize sedan is only ever compared with 2011–2015 midsize sedans. The index measures complaint intensity against a same-segment, same-era cohort, nothing more, and we say so.
Intervals before flags
A deterministic parametric bootstrap runs 2,000 resamples. A record is flagged only when its whole 95% interval clears the 8.0 threshold.
Open, versioned, falsifiable
The full pipeline, from source files to cleaning rules to formulas, is published and versioned. When v1.4 ships, you’ll see the changelog. An index is only worth what you can check.
Independent by design
No manufacturer, dealer network, or ad buyer touches the math. MotorCensus sells nothing about the cars it scores, so a number only moves when owner reports move it. The record speaks, we translate.
Published complaint reports by covered make, snapshot 2026-07-19
Browse the record
 Ford93,471 reports across 4 models
 Honda60,212 reports across 4 models
 Toyota41,251 reports across 4 models
 Hyundai36,846 reports across 4 models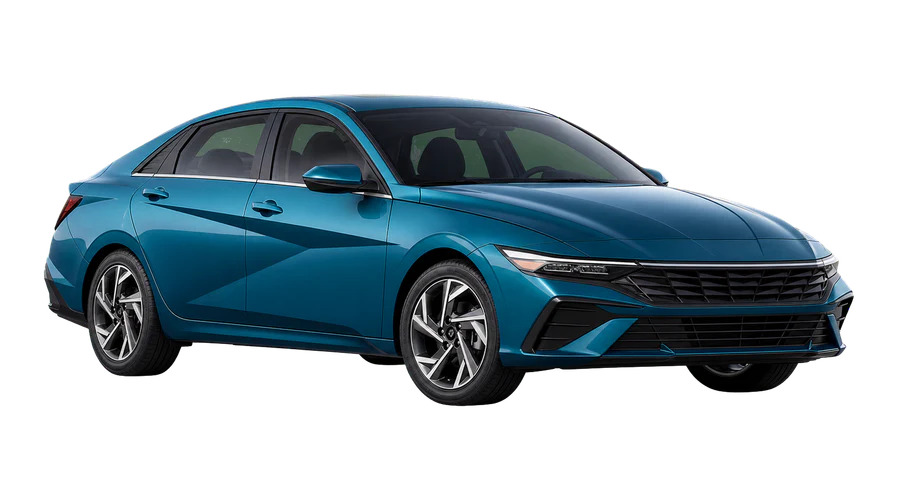
 Chevrolet36,625 reports across 4 models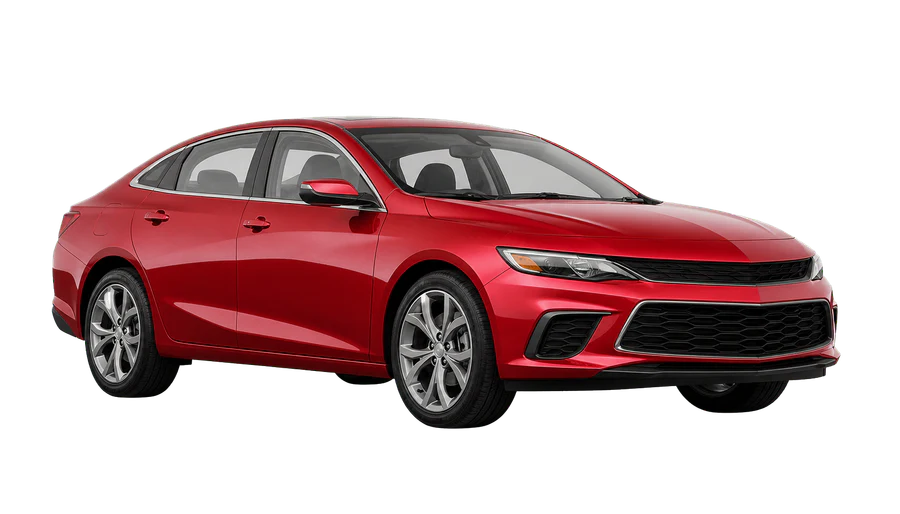
 Nissan32,625 reports across 4 models
 Kia23,623 reports across 4 models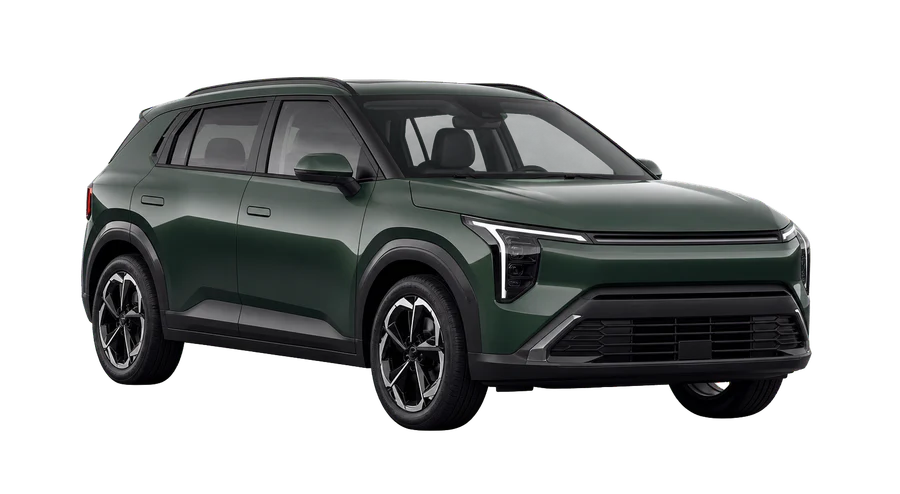
 Jeep20,738 reports across 1 model
 Volkswagen16,381 reports across 2 models
 Subaru8,661 reports across 2 models
 Mazda2,091 reports across 1 model